Intro
Cross validation is one of the most popular methods for estimating test error and selecting tuning parameters, however, one can easily be mislead/confused by it without realising it.
In chapter 5 of An Introduction to Statistical learning, the authors stress that if a dataset has a lot of features and relatively fewer observations, the variable selection process should also be cross validated.
To see how things can go wrong in action, I simulated 1000 independent standard normal random variables, x1 - x1000, each with 100 observations and an independent standard normal target, y. So I was just simulating a bunch of norm noise without any real signal in them. By design, the best model is just the intercept model (i.e. predicting 0 regardless of xs) and the root mean squared error (rmse) for this intercept model is 1 (because the target is standard normal). I should not expect that one can build a model and improve rmse on test set.
library(dplyr)
library(purrr)

set.seed(123)
N <- 100; n_features <- 1000; K <- 5

data <-
  data.frame(
    y = rnorm(N),
    setNames(lapply(rep(N, n_features), rnorm),
             paste0("x", 1:n_features))
  ) %>%
  mutate(fold = rep_len(1:K, length.out = nrow(.)))
The Wrong Way
A modeller takes my dataset and finds that there are moderate correlations between some xs and y, and that the top 5 variables are not correlated:
top5 <-
  data[, -1] %>%
  map_dbl(~ abs(cor(., data$y))) %>%
  sort %>%
  tail(5)
top5
## x118 x561 x678 x804 x429
## 0.2865045 0.2869500 0.2920466 0.3012629 0.3055009plot(data[, c("y", names(top5))])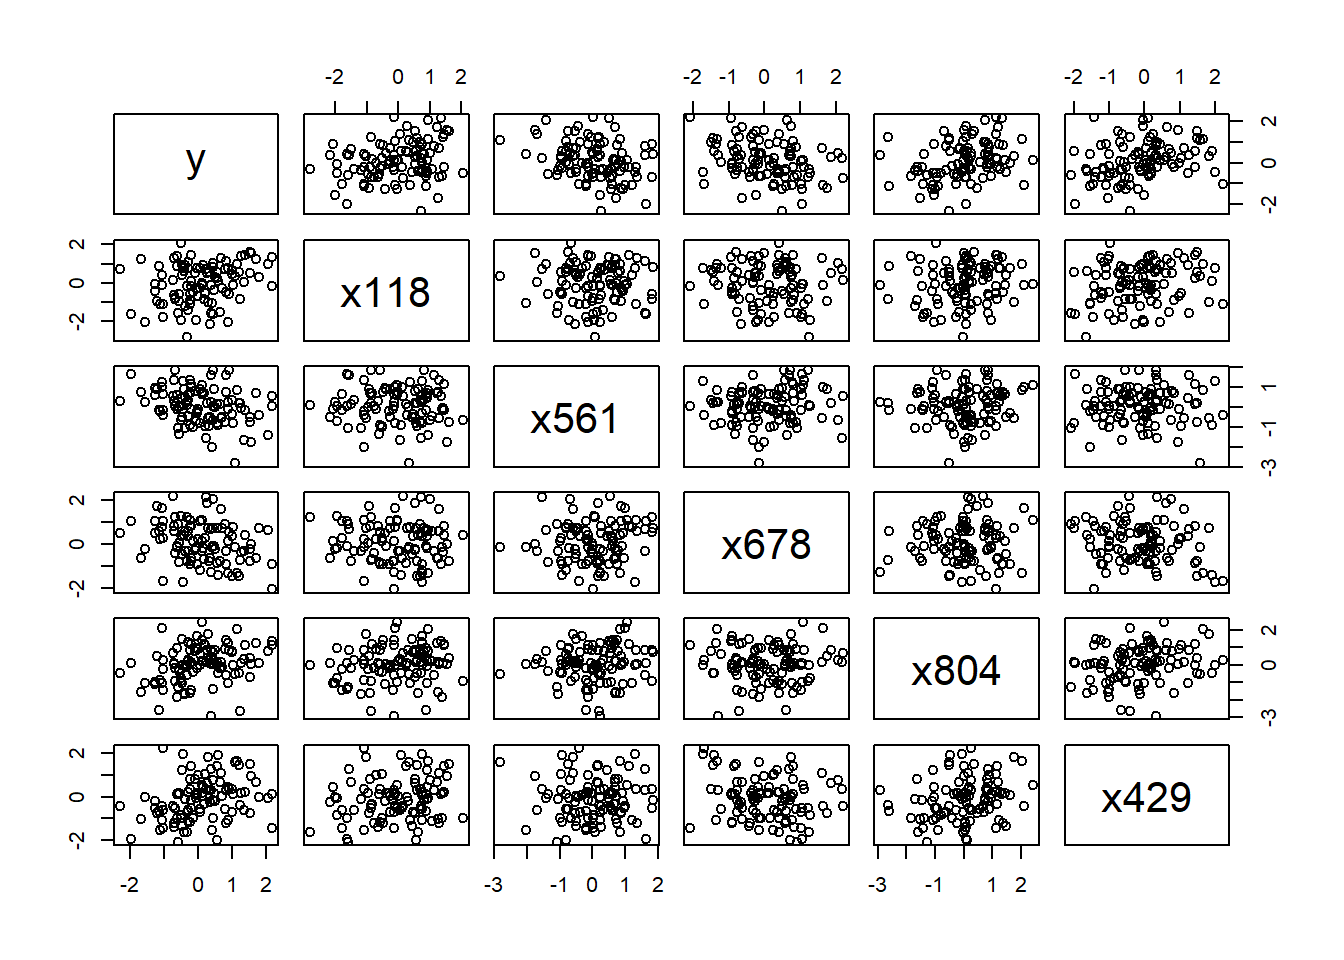
So he decided to use these 5 features to fit a linear model as a starting point and use cross validation to estimate the test error:
formula <- paste0("y ~ ", paste(names(top5), collapse = " + "))
formula
## [1] "y ~ x118 + x561 + x678 + x804 + x429"rmse_train <- rmse_val <- double(K)
for (i in 1:K) {
mod <- lm(formula, data = data[data$fold != i, ])
rmse_train[i] <- sqrt(mean(resid(mod)^2))
pred <- predict(mod, newdata = data[data$fold == i, ], type = "response")
rmse_val[i] <- sqrt(mean((pred - data$y[data$fold == i])^2))
}
summary(mod)##
## Call:
## lm(formula = formula, data = data[data$fold != i, ])
##
## Residuals:
## Min 1Q Median 3Q Max
## -2.1560 -0.5050 -0.1391 0.5061 1.7522
##
## Coefficients:
## Estimate Std. Error t value Pr(>|t|)
## (Intercept) 0.19217 0.08944 2.149 0.03494 *
## x118 0.11046 0.08269 1.336 0.18570
## x561 -0.23794 0.10147 -2.345 0.02172 *
## x678 -0.25883 0.09391 -2.756 0.00736 **
## x804 0.24654 0.08668 2.844 0.00575 **
## x429 0.26453 0.09818 2.694 0.00872 **
## ---
## Signif. codes: 0 '***' 0.001 '**' 0.01 '*' 0.05 '.' 0.1 ' ' 1
##
## Residual standard error: 0.7593 on 74 degrees of freedom
## Multiple R-squared: 0.3681, Adjusted R-squared: 0.3254
## F-statistic: 8.621 on 5 and 74 DF, p-value: 1.788e-06mean(rmse_train)## [1] 0.7384612mean(rmse_val)## [1] 0.7942366The model looks pretty good. On both training and test sets, the root mean squared error has reduced from about 1 (one would get from an intercept model) to just below 0.8 and the F test shows gives a p-value that is basically 0. However, he doesn’t realise that he’s just fitting to the noise and the true rmse for his model on a test data set is larger than 1. That is, he’s estimate for test error is biased upwards.
The Right Way
The right way to do cross validation is to include the feature screening process in the cross validation as well. In the example below, you can see that although on the training data the rmse has reduced to 0.86, the validation set averages at around 1.1. which is a better estimate of test error.
for (i in 1:K) {
  formula <-
    data %>%
    filter(fold != i) %>%
    select(-fold, -y) %>%
    map_dbl(~ abs(cor(., data$y[data$fold != i]))) %>%
    sort %>%
    tail(5) %>%
    names %>%
    paste(collapse = " + ") %>%
    paste0("y ~ ", .)

  mod <- lm(formula, data = data[data$fold != i, ])
  rmse_train[i] <- sqrt(mean(resid(mod)^2))

  pred <- predict(mod, newdata = data[data$fold == i, ], type = "response")
  rmse_val[i] <- sqrt(mean((pred - data$y[data$fold == i])^2))
}
mean(rmse_train)
## [1] 0.7026851mean(rmse_val)## [1] 1.127504what is the true test error for the 5-predictor model? Below I simulated 500 test sets and predict on each set and take the average of rmse’s. It turns out that it is indeed around 1.1 (cv estimate for test error is slightly biased upwards as the models are fitted to a subset of the data).
mod <-
  data[, -1] %>%
  map_dbl(~ abs(cor(., data$y))) %>%
  sort %>%
  tail(5) %>%
  names %>%
  paste(collapse = " + ") %>%
  paste0("y ~ ", .) %>%
  lm(data = data)

rmse_test <- double(500)

for (i in 1:500) {
  test_data <-
    data.frame(
      y = rnorm(N),
      setNames(lapply(rep(N, n_features), rnorm), paste0("x", 1:n_features))
    )

  pred <- predict(mod, newdata = test_data, type = "response")
  rmse_test[i] <- sqrt(mean((pred - test_data$y)^2))

}

mean(rmse_test)
## [1] 1.117278To see how the wrong test error estimate varies as sample size varies, I wraped the above wrong cross validation inside a function so I can iterate quickly on different sample sizes. The plot below shows the wrong estimate for rmse as a function of sample size, keeping number of features at 1000:
rm(list = ls(all.names = TRUE))
set.seed(1000)
compare_cv <- function(N, n_features, top_features, K) {

  data <-
    data.frame(
      y = rnorm(N),
      setNames(lapply(rep(N, n_features), rnorm), paste0("x", 1:n_features))
    ) %>%
    mutate(fold = rep_len(1:K,length.out = nrow(.)))

  rmse_val <- numeric(K)

  # wrong cv
  formula <-
    data[, -1] %>%
    map_dbl(~ abs(cor(., data$y))) %>%
    sort %>%
    tail(top_features) %>%
    names %>%
    paste(collapse = " + ") %>%
    paste0("y ~ ", .)

  for (i in 1:K) {
    mod <- lm(formula, data = data[data$fold != i, ])
    pred <- predict(mod, newdata = data[data$fold == i, ], type = "response")
    rmse_val[i] <- sqrt(mean((pred - data$y[data$fold == i])^2))
  }
  mean(rmse_val)
}

sample_sizes <- seq(10, 1000, by = 10)

plot(sample_sizes, sapply(sample_sizes, compare_cv, n_features = 1000, top_features = 5, K = 5 ), xlab = "Sample size", ylab = "Wrong estimate for test rmse", ylim = c(0.2, 1.3), type = "b", pch = 19, main = "Wrong cross validation" )
abline(a = 1.12, b = 0, lty = 2)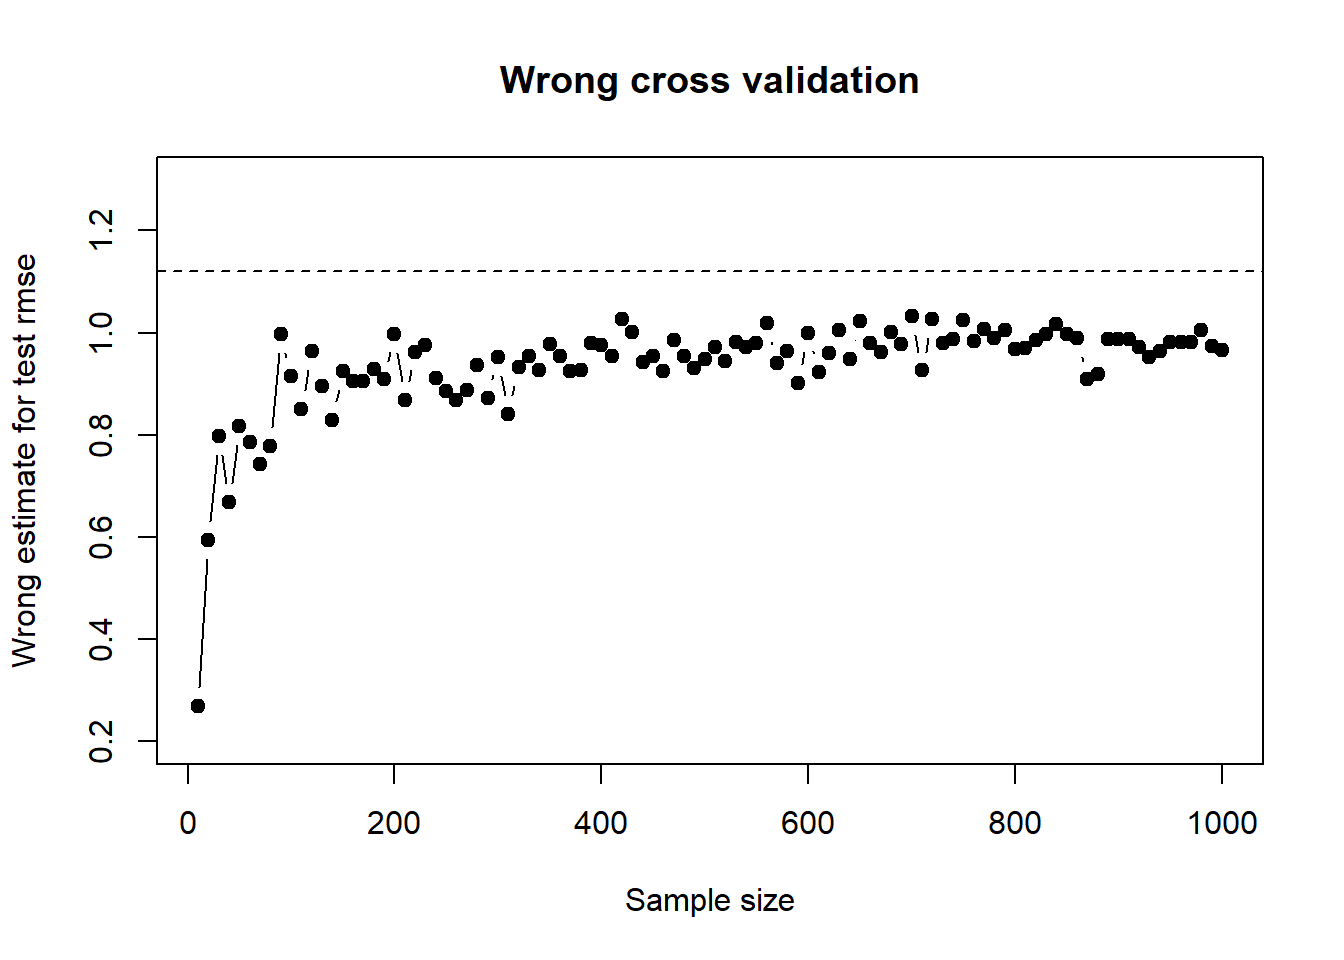
summary
The key takeway from this exercise is that feature selection should be cross validated, especially when sample size is small and feature space is large. Perhaps the first thing to do when modelling is to set aside a test set.